About Me
I work on backend systems at Chartbeat. In my free time, I like to write about computers!
Previously I worked as a research software engineer at the Center for Constructive Communication, a part of the MIT Media Lab. Before joining the Media Lab, I was a graduate student at the University of Chicago, where I studied data science and public policy in the Computational Analysis and Public Policy master's program.
Projects
Two-Bit History

This is my blog about the history of computing and in particular the history of software development. There is a lot of writing out there about A) vintage computers and B) Silicon Valley's seminal corporate triumphs. But what about important questions like Where did JSON come from? or Why are man pages still a thing?
My history of the RSS standard was published by Vice News. Another article I wrote about the rendering technology in DOOM was republished by Ars Technica.
I was also interviewed for the podcast Secret History of the Future, which is jointly produced by Slate and The Economist.
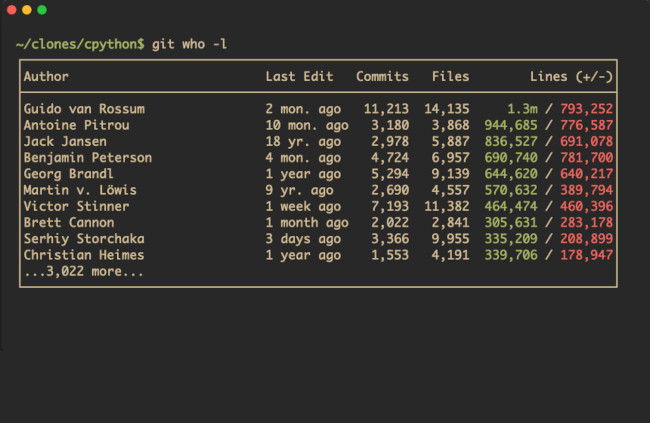
Git Who

A command-line tool for exploring authorship in a Git repository.
A bit like a super-powered version of git blame. I wrote
a blog post demonstrating Git Who's capabilities that you can find
here.
Over 2.1k stars on Github. Built in Go.
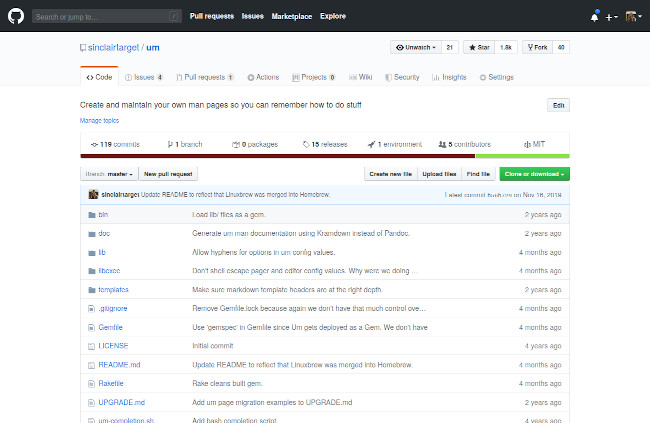
um

A command-line tool to create and manage a parallel set of man pages—except these man pages, rather than being incomprehensibly dense, are your notes on how a program works.
Over 1.9k stars on Github. Built in Ruby.
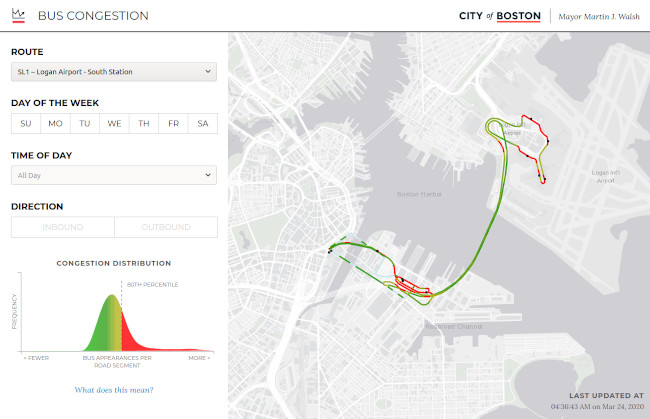
Boston Bus Route Visualization

A visualization of traffic congestion along Boston bus routes. I created this visualization while working as a summer fellow with the City of Boston Data Analytics team.
I built the frontend using MapboxGL and D3.js and the backend ETL pipeline using Postgres, PostGIS, and Pandas.
The Monopolists Are Winning

A data analysis and visualization project using US Census Bureau data to explore how industries in the United States have grown more concentrated over time. Built with D3.js and R.
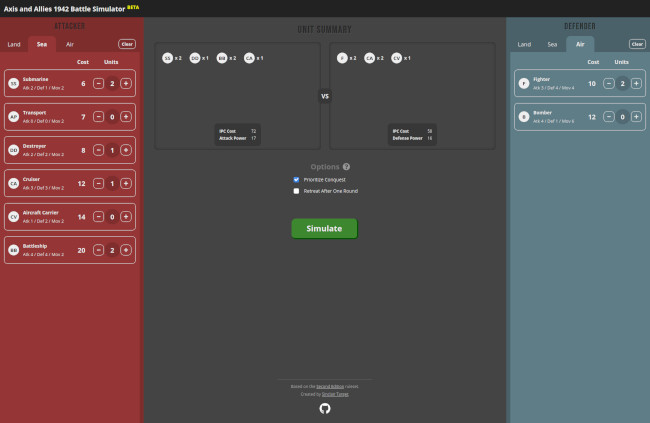
Axis and Allies Battle Simulator

A handy tool that allows hardcore players of the board game Axis and Allies 1942 to calculate the odds of winning a battle against their opponent. Built with D3.js and React.
Talks
| Iterators 💔 Error Handling | Given at the July 2025 meetup of the Boston Golang group. |
| The Billion-Request Challenge | Given at PyData NYC 2023, in collaboration with colleagues of mine from Chartbeat. |
Resume
You can find my resume here.
Contact
You can reach me at sinclairtarget@gmail.com.